Dynamic Region Monitoring
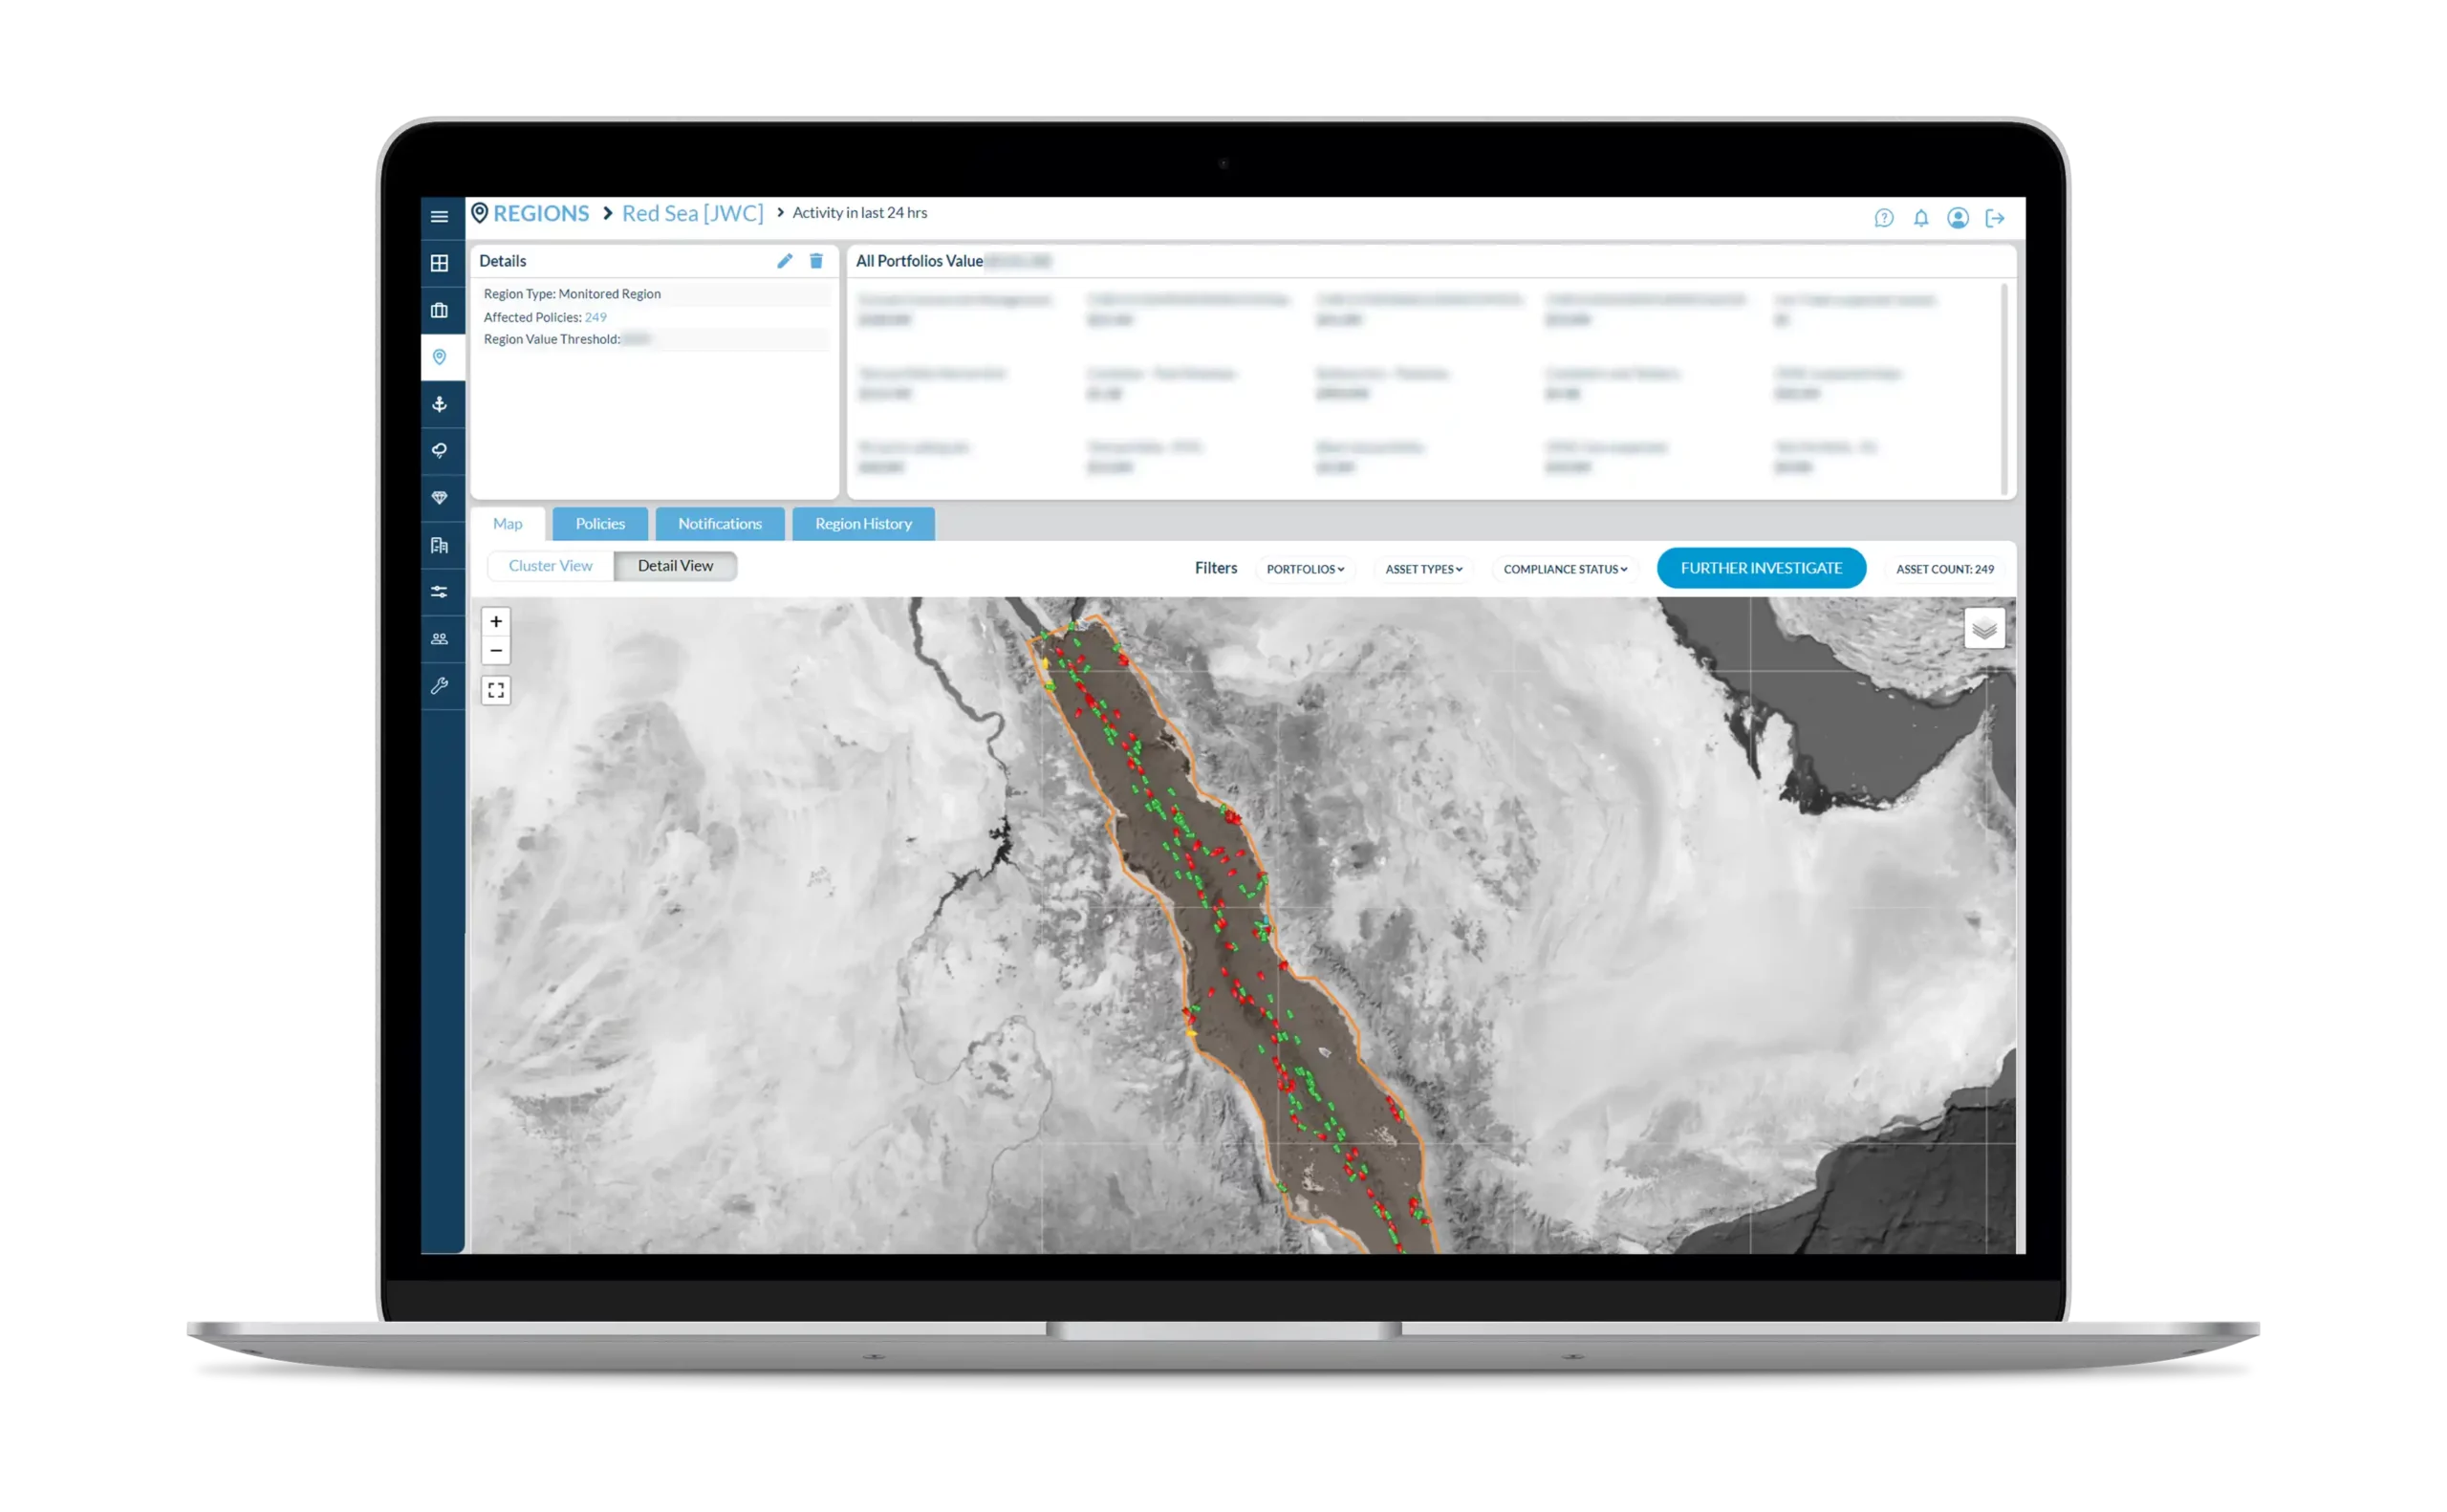
The platform has a powerful feature that automates the region monitoring process. The user can ‘ask’ the system where areas of high activity are present across the globe. The system can assist in providing valuable information in the initial selection and validation of wind energy sites.
Data Intelligence
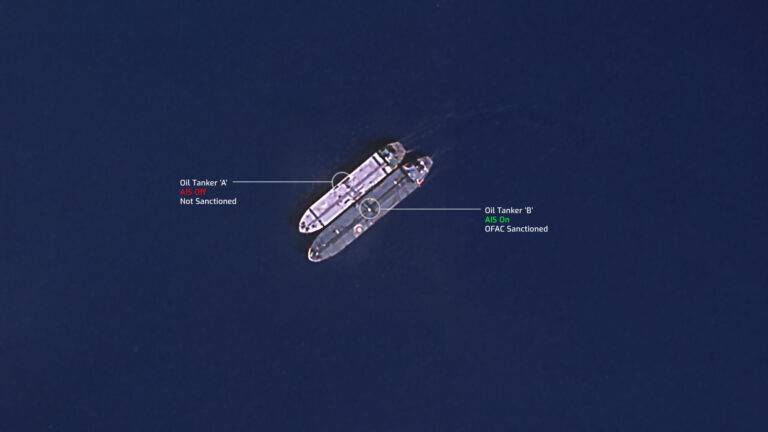
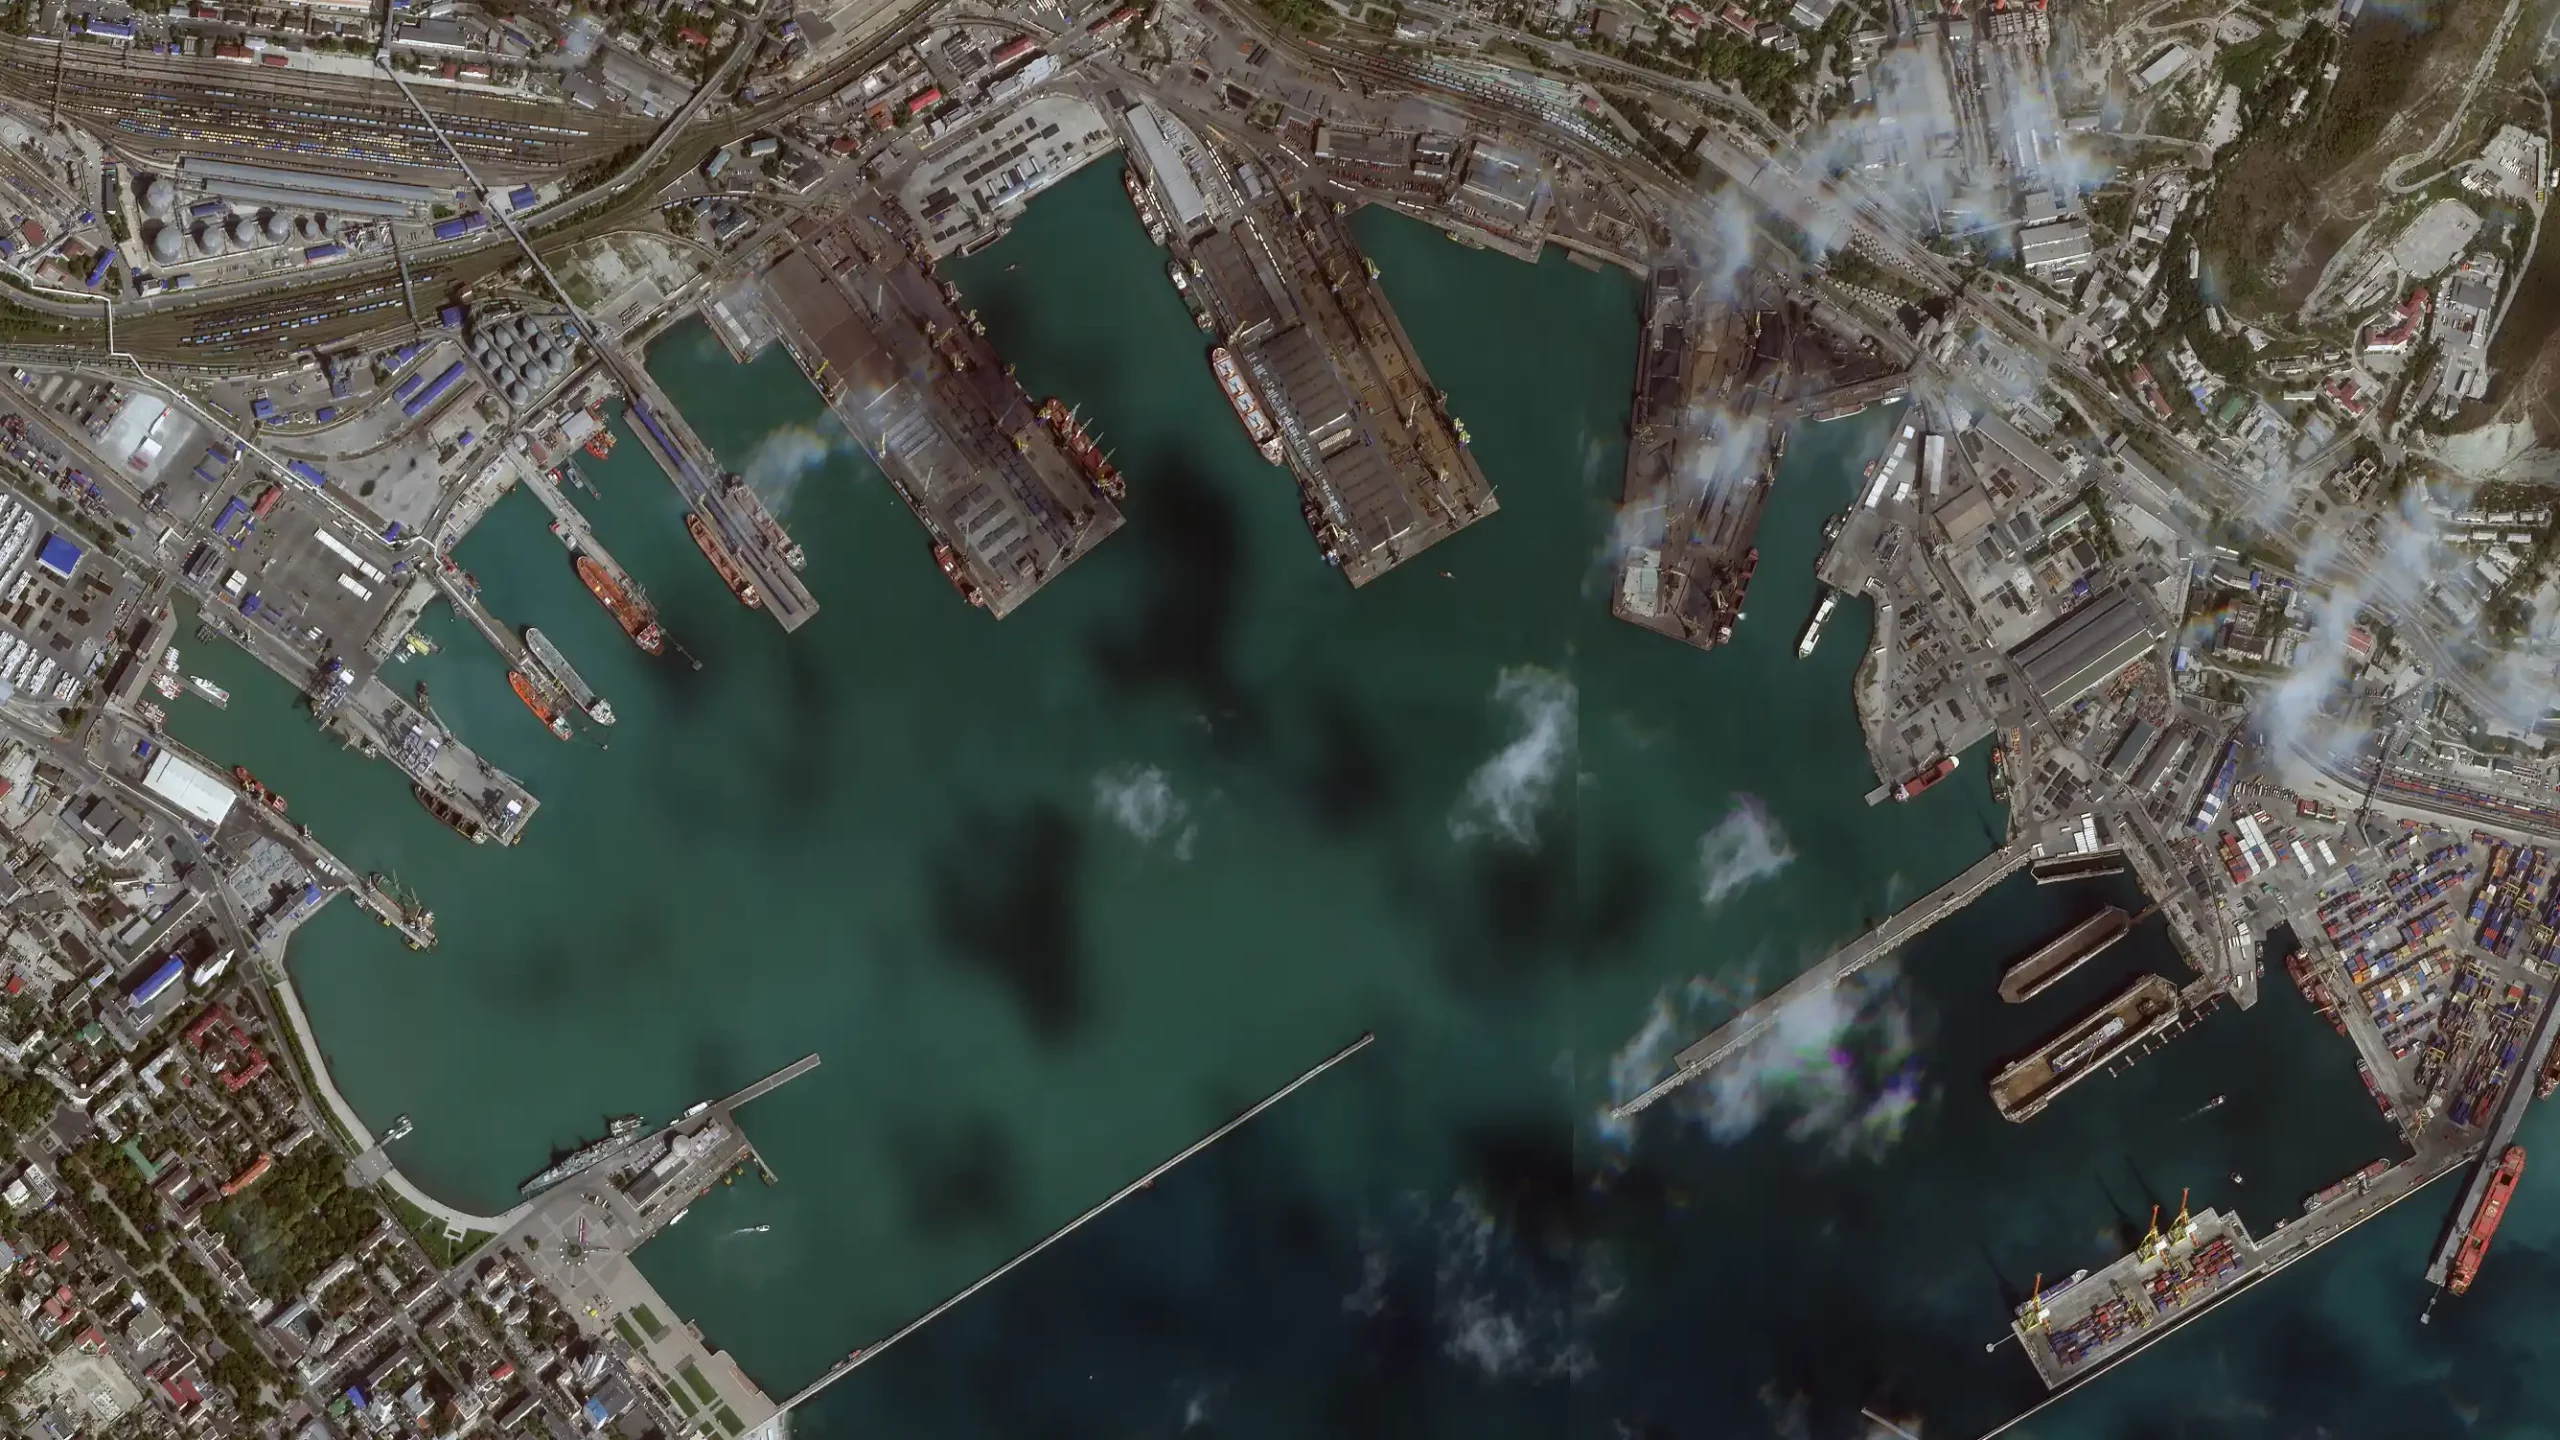
We offer a versatile system that has the ability to ingest various sources such as AIS (Automatic Identification System), SAR (Synthetic Aperture Radar), EO (Earth Observation), optical satellite imagery, VMS (Vessel Monitoring System), and RFM (Radio Frequency Monitoring), ensuring an accurate and complete representation of exposure on ground.
Historical Analysis & Heat Maps
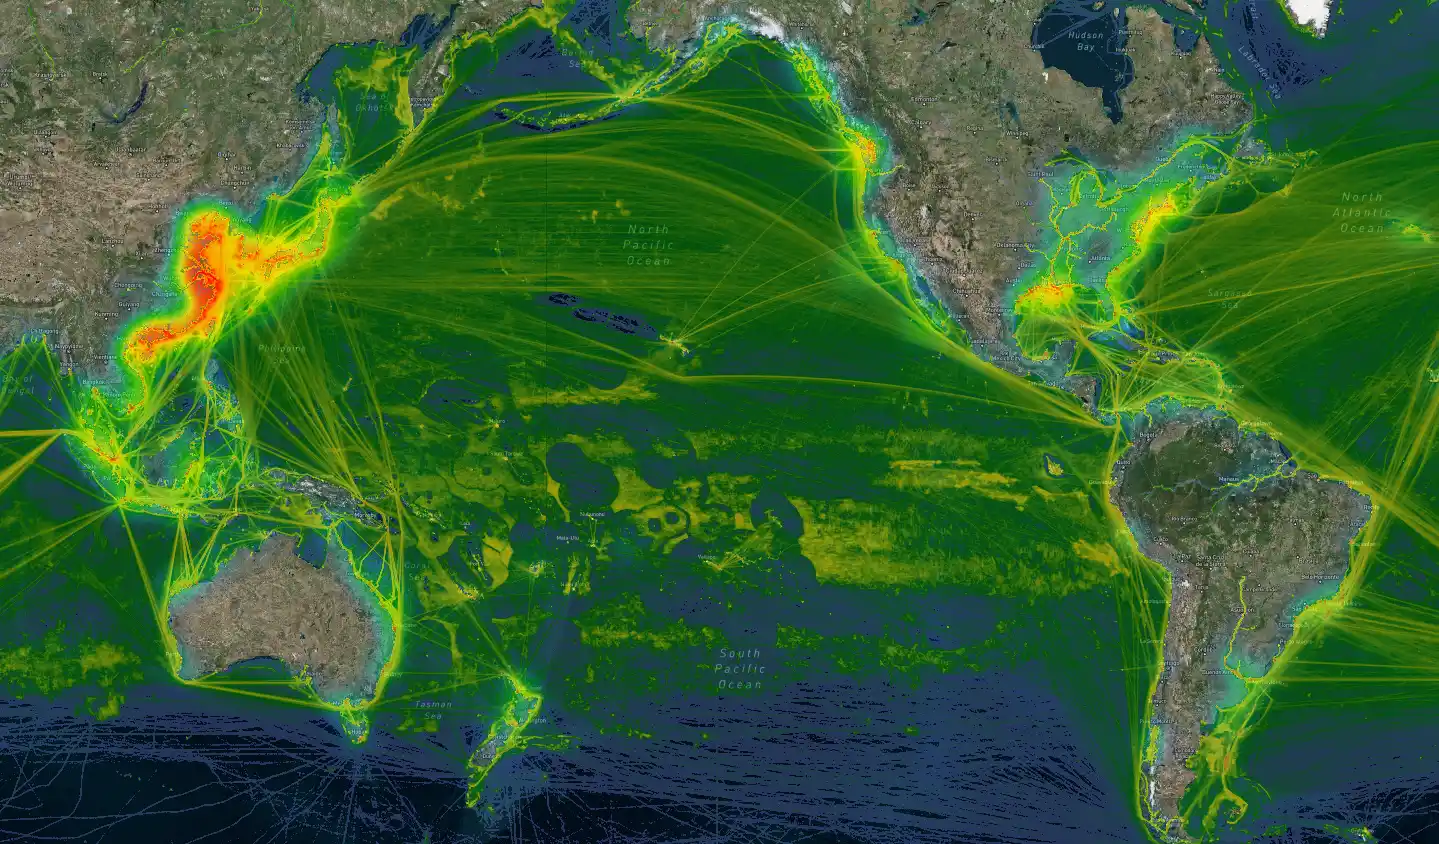
Our platform is designed to allow users to make informed decisions based on facts, backed up by significant amounts of data and complex aggregation analysis. By investigating vessel movements and usage in a specific area of interest, the users can understand behavioural patterns and identify trends. This provides them with the ability to compare and benchmark on a global basis, allowing them to easily identify areas of potential interest for future asset deployment, using a graphical and visual representation of data such as Heat Maps. This representation allows users to better visualise the volume of items, such as fishing vessels, in the defined region of interest.
Pre/Post Event Analysis
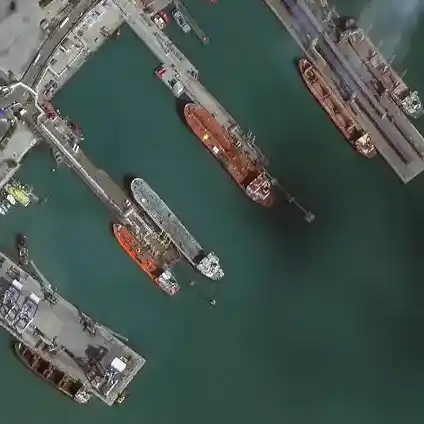
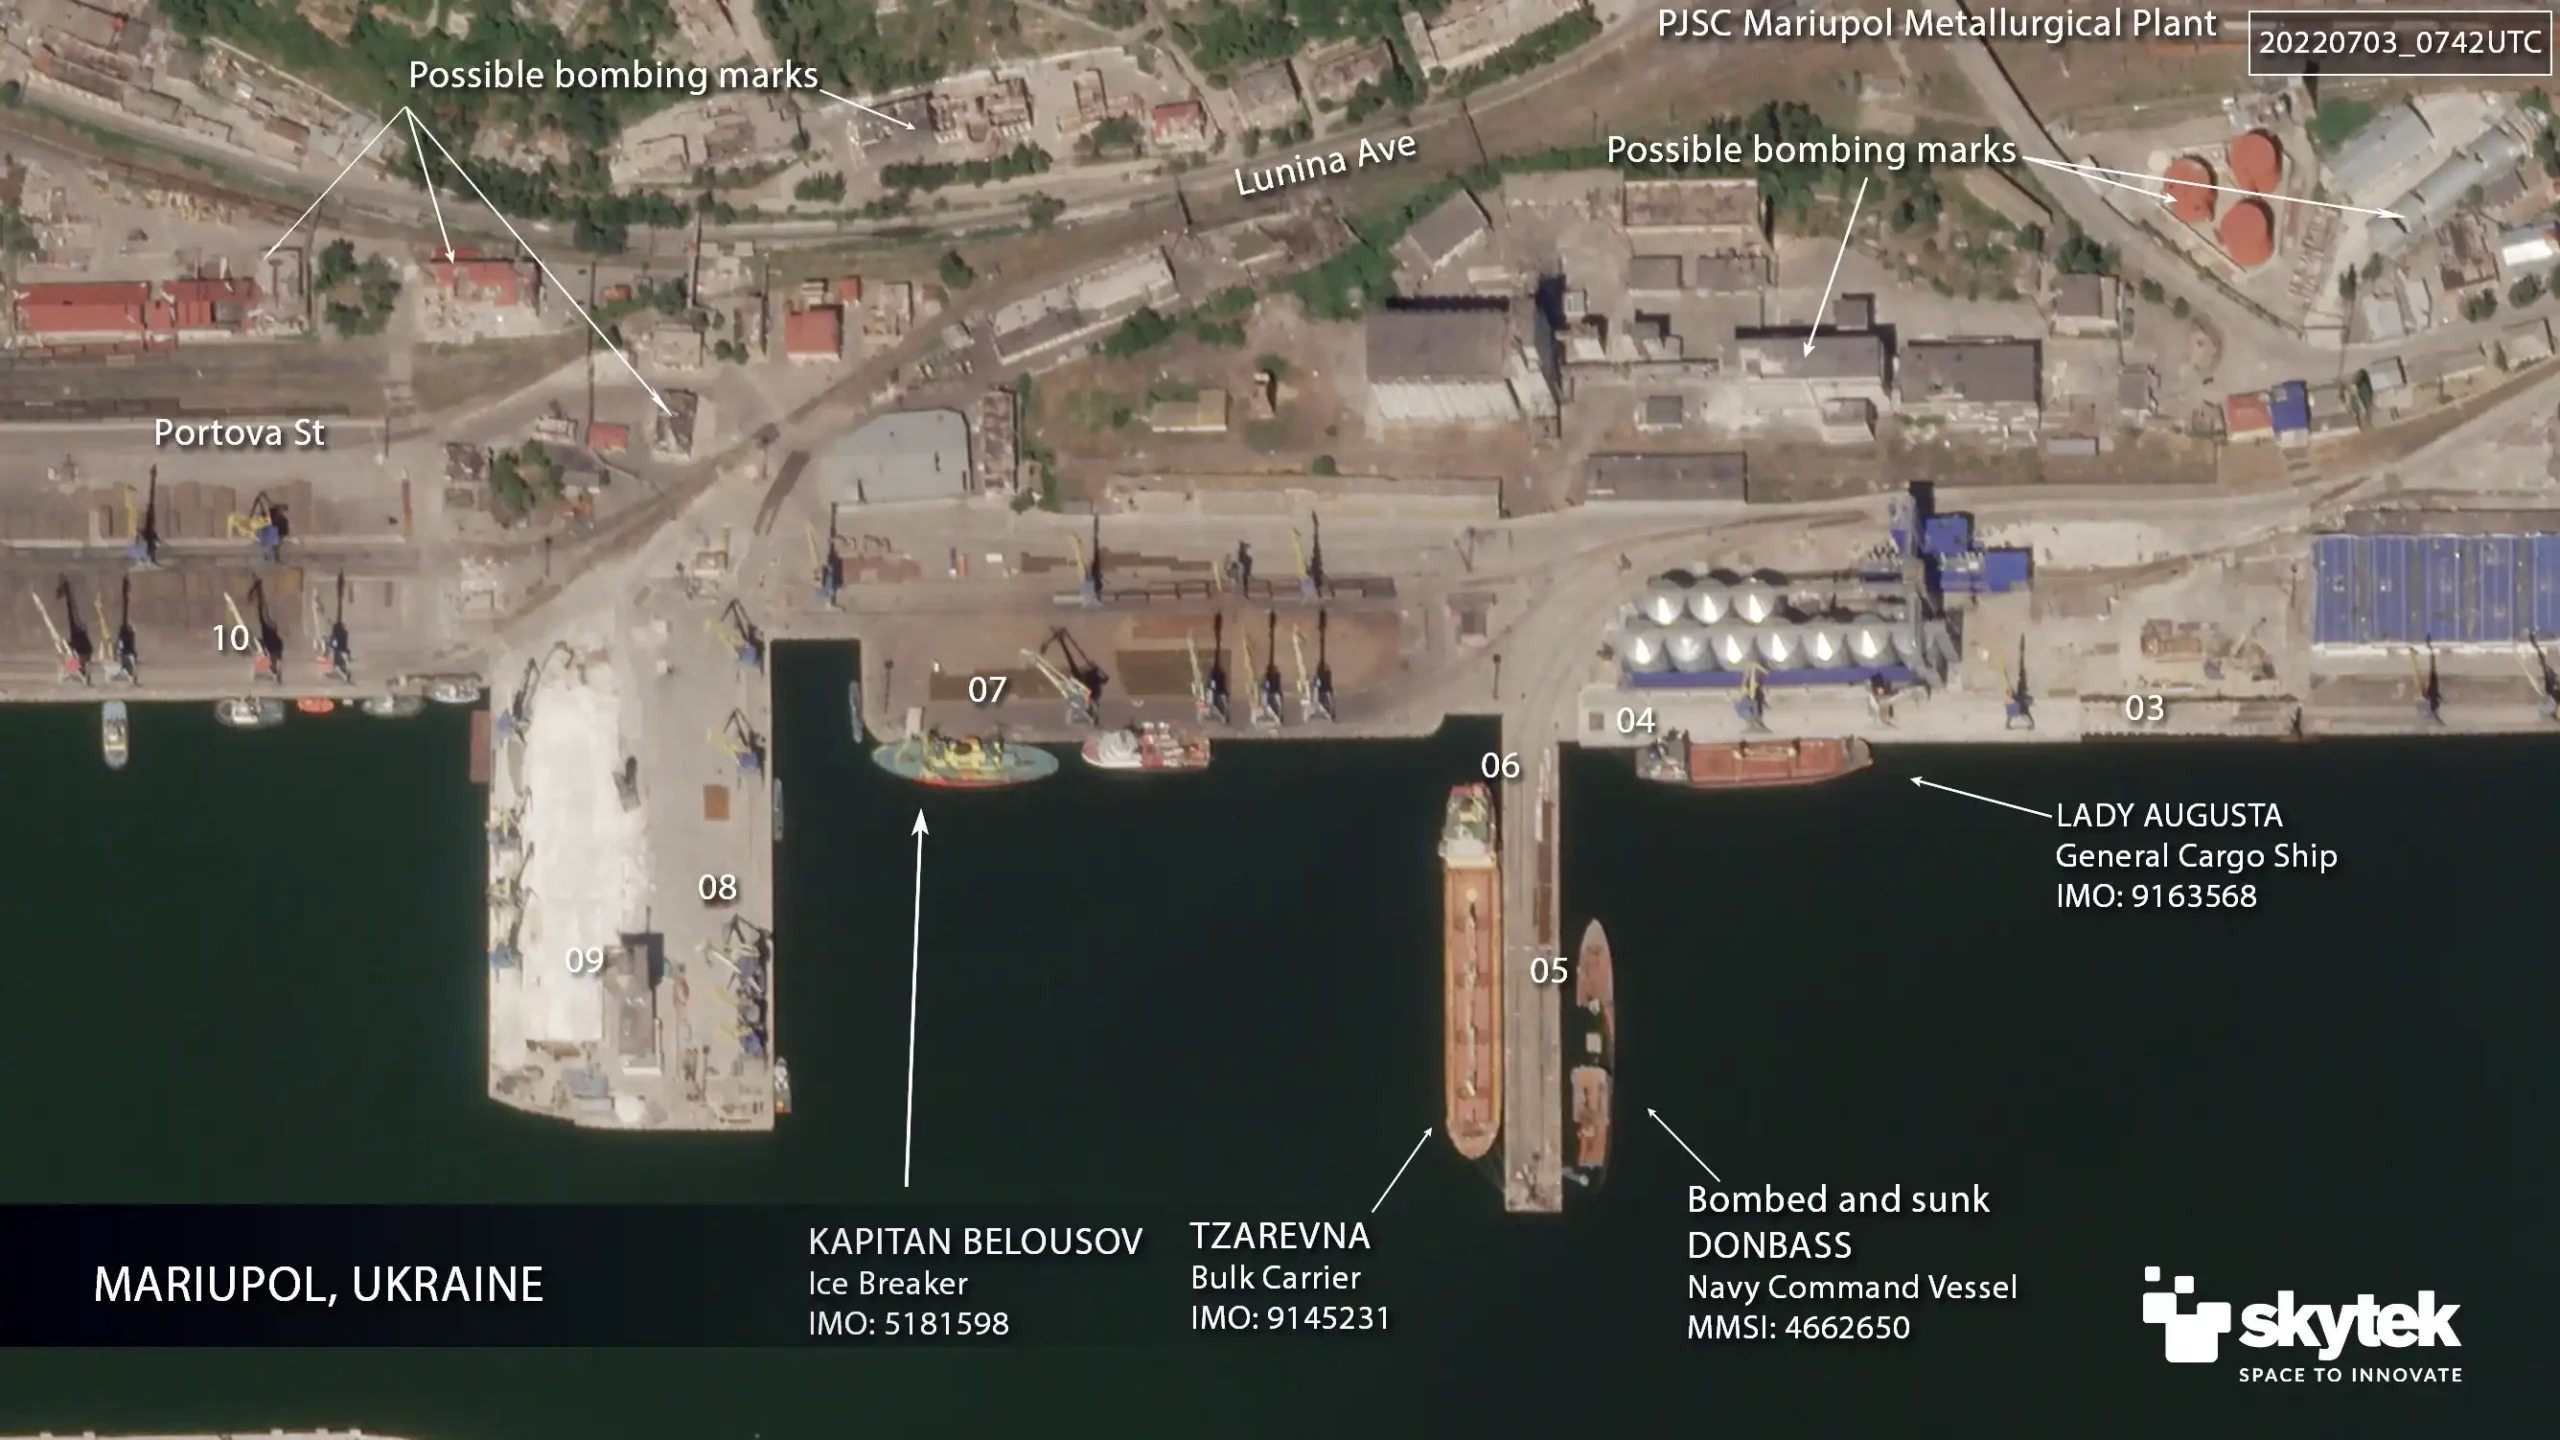
Visible and radar (SAR) satellite data are tasked pre and post-event, providing data for the system for automatic detection and identification of changes associated with the catastrophe. This functionality allows users to efficiently receive information about the status of their assets in the immediate aftermath of the event, empowering them to make informed decisions.

